CLV Benchmark Report

Welcome to Retina.ai’s Interactive CLV Benchmark Report, here you will be able to explore different e-commerce KPIs for specific companies and competitors!
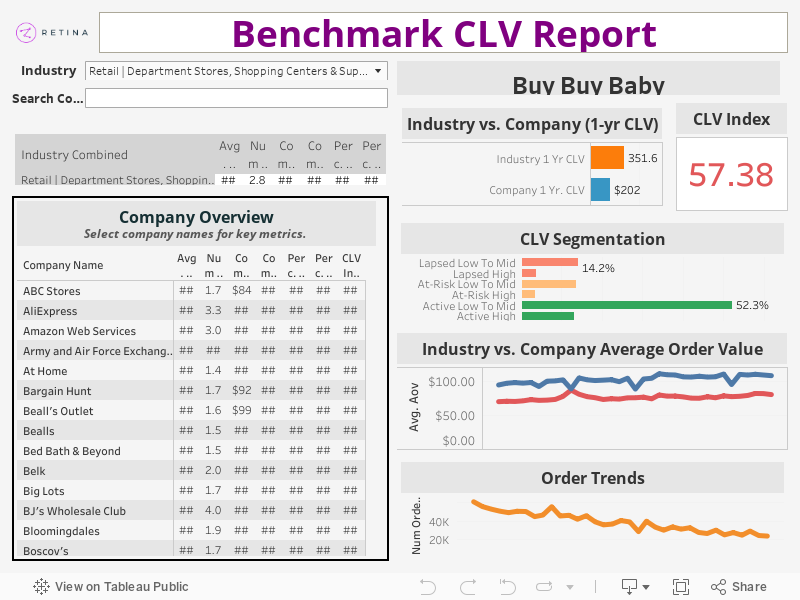
Try the Report Now

We have compiled a list of the top companies in the United States for each industry, and have calculated KPIs for each of them, including AoV and first-year CLV. This benchmark report is compiled from a panel of 10 million anonymized (privacy safe) US consumers’ credit card and bank statements. While this doesn’t represent exact metrics from these companies, our experts agree they line up with the current market. 

Below you can explore different industries and the various companies associated with them. In the report, you can see the definitions of each metric by clicking or hovering over them

If you do not see a specific company you are looking for, or are looking for further information on how to calculate CLV contact us and we will be happy to help.

Metrics Definitions:

  • AoV: Average order values is the mean of all the orders from this merchant. Avg. Order per Customer is the average number of orders a person has made in the last 3 years.
  • 1-yr CLV: The average amount a person will spend in their first year.
  • 2-yr CLV: The average amount a person will spend in their first 2 years.
  • % Digital Purchase: The percentage of purchases that were made online.
  • % Offline Purchase: The percent of purchases that were made in-person.
  • CLV Index: The index of how a company’s 1 year CLV compares to the industry average. Number above 100 indicates the merchant is beating the average and anything below 100 indicates they are below the industry average.


  • CLV Segmentation: In this section, we use Retina’s predictive field to segment the user base into high/low CLV and their churn behavior based on their transactional purchasing behavior.
    • Lapsed – customer no longer is purchasing from this vendor
    • At-Risk – customer has made a transition somewhat recently but is as the risk of churning
    • Active – the customer is active and will most likely make a transaction.
    • Low to Mid – Bottom 80% of the 1 year CLV values
    • High – Top 20% of the 1 year CLV values

Don’t see on of your competitors or want to learn how to measure you CLV? Get in contact with us and we would love to discuss.