
Simply put, customer lifetime value (CLV) is a customer’s value to your business. You can calculate CLV of past customers, current customers and future (hypothetical) customers. Often, the CLV story is about predicting revenue from orders data.
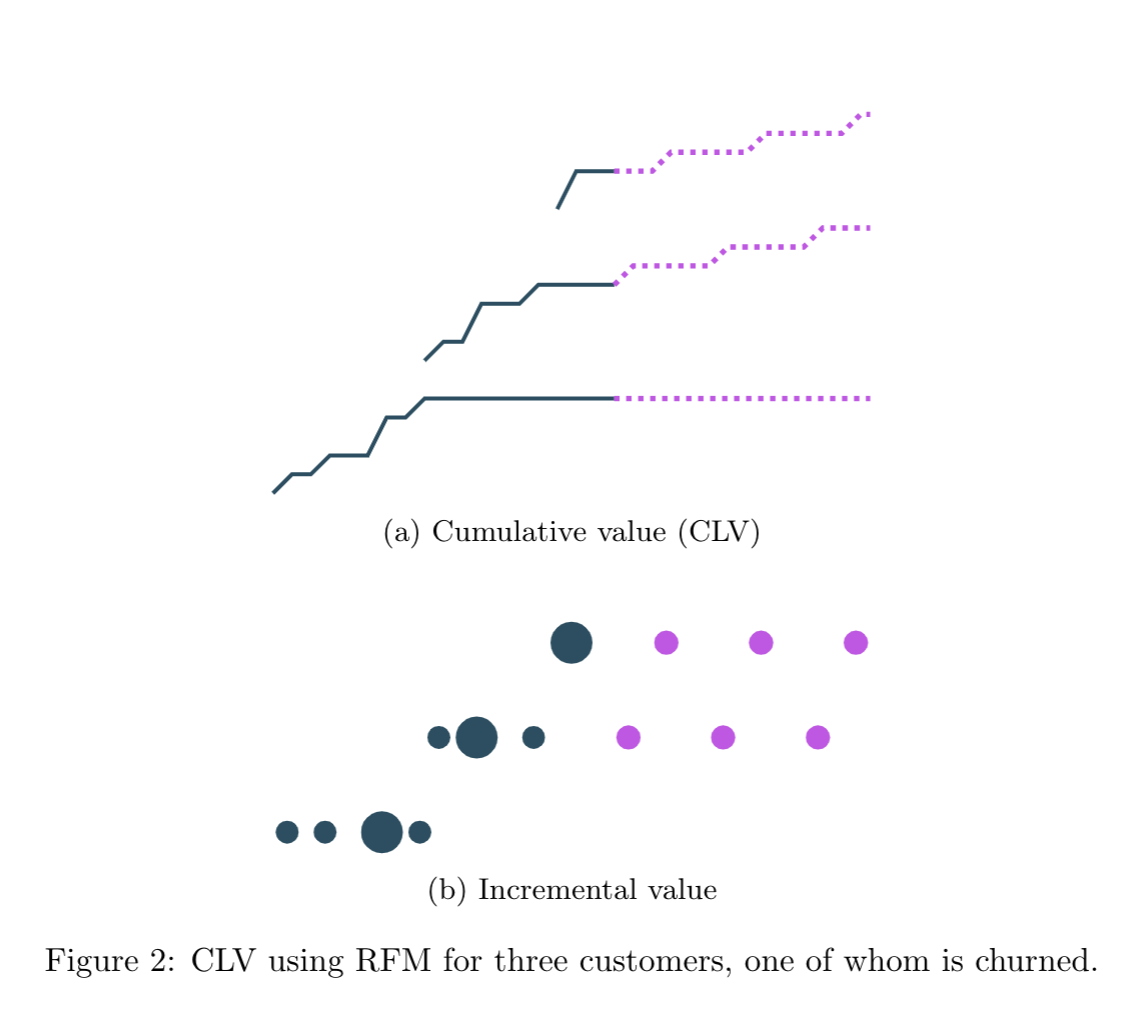
A keen awareness of the past allows for realistic assumptions about the future. CLV is known for past customers, an educated guess for hypothetical customers, and somewhere in between for active customers.
CLV can be aggregated over time, with value possibly discounted by time. CLV aggregations are common and explain why CLV is often seen as a single number.
RFM models
It’s not difficult to approximate total cohort-level CLV from basic orders data. Here is an intuitive and widely-known approach: use customer-level recency (R), frequency (F), and monetization (M) in order to (i) identify customers as active or churned and (ii) simulate orders behavior into the future. Models that build on this type of behavior are known by the acronym RFM.
Recency indicates whether customers are labeled as active or churned. Let’s assume churn transitions are independent and identically distributed (IID) as well as memoryless, so that the remaining-order count (in expectation) is the inverse fraction of churn rate. Putting together
- active-customer count,
- expected remaining-order count,
- and average order value
gives you total predicted CLV for the cohort.
Example: In the last 52 weeks, data records indicate 101,512 transactions totaling $712,410 from 52,127 unique customers. Of whom, 16,203 are labeled as churned (say, because their recency was in the top quartile of all intra-event times).
Solution: Then the churn rate is 16,203/101,512 = 0.16 and 1/0.16 = 6.25 is the expected number of remaining orders for the 52,127 – 16,203 = 35,924 active customers. The average order revenue is $712,410/101,512 = $7.02 per order. So future cohort CLV is 35,924 x 6.25 x $7.02 = $1,576,166. Putting this together, cohort CLV is $712,410 + $1,576,166 = $2,288,576. Notice that revenue recorded by this cohort so far comprises roughly 31% of its total lifetime revenue.
Flavors and variations
Let’s align on precise language for discussing similarities and differences in CLV. Flavors of CLV arise from variations in (1) naming, (2) value and (3) scope.
First, CLV has come to be known by many different names. Here are a few:
- Customer lifetime value (CLV)
- Lifetime value (LTV)
- Predicted lifetime value (pLTV)
- Lifetime revenue (LTR)
- Customer-level lifetime value (CLTV)
And there are certainly many more. Names are names and we’re all talking about variations on the same ideas: customer behavior, prediction, and analytics over time.
Next, the definition of “value” may vary. It’s common to use currency (either revenue or profit) and currency may or may not be discounted by time. Value may also indicate product demand, referring to direct product purchases or indirect website visits, app log-ins or product page views.
Finally, CLV can refer to customer value that’s been aggregated over customers, time, both or neither. CLV may refer to the total value from a cohort of customers, which is a back-of-the-envelope calculation. In addition, CLV may refer to total value over a period of time, such as:
- a customer’s lifetime
- increments of years, quarters or months (common in retail)
- in increments of weeks, days or hours (common in gaming)
When time periods extend from present to future, we typically say Future or Predicted CLV; meanwhile time periods that include the past are Total CLV.