You have a working model. You have spent days, even weeks to reach this stage. Now you are preparing for the big day, the day you are going to present your model to the leadership team. This post shares key things to keep in mind to deliver the best presentation possible on your big day.
Before Building the Model
Before jumping right in, let’s take a few steps back to look at considerations before building a model. I will share some points here which are important to ensure you have an effective presentation once the model is complete.
Before building a model, the most important step is to define the business problem to be solved. Next, outline the expectations from the solution (model) clearly. A vague problem results in a vague solution, and we cannot accurately measure the model’s success.
Once you have a relevant and clean dataset for building the model, think carefully about the technique to be used for modeling. If the business problem can be solved (i.e. satisfies the goal we defined) using a simple technique like regression, then there is no need to use more complex techniques that may need more data, time, and resources to build.
Another important point to consider is model interpretability. If your leadership is interested in learning how the various variables affect the outcome of the model, then interpretability becomes an important consideration for choosing a technique. Generally, it is easier to sell an interpretable model than a black box model using complex techniques.
Pyramid Principle of Communication
A common mistake when presenting model results is to get bogged down by technical details of the model without driving home three main things:
- The business problem
- The solution: the model
- Supporting arguments based on the model’s structure and results
Pyramid Principle is a methodology of structured communication that follows a top down structure, where we start with the punchline first. Executives are busy people and want to get to the meat of the conversation as quickly as possible. The Pyramid Principle does precisely that. As per Ameet Ranadive, a former associate from McKinsey and a product leader, the key takeaways of the Pyramid Principle are:
- Start with the answer first
- Group and summarize your supporting arguments
- Logically order your supporting ideas
1. Start with the answer first
As per the Pyramid Principle, when the leadership team asks “What should we do?”, you should answer “We should do X” very directly and then move on to supporting reasons. Similarly, when presenting a model, it is important to bring up the business question that the model solves and summarize the model’s value. For example, you can say ‘To improve our revenue recognition process, we have built a demand forecasting model that improves forecast accuracy over the current process by 50%.’ Not only is this descriptive, it gives a punch line for executives who think in a top-down manner and helps them process your recommendation quickly.
2. Group and summarize your supporting arguments
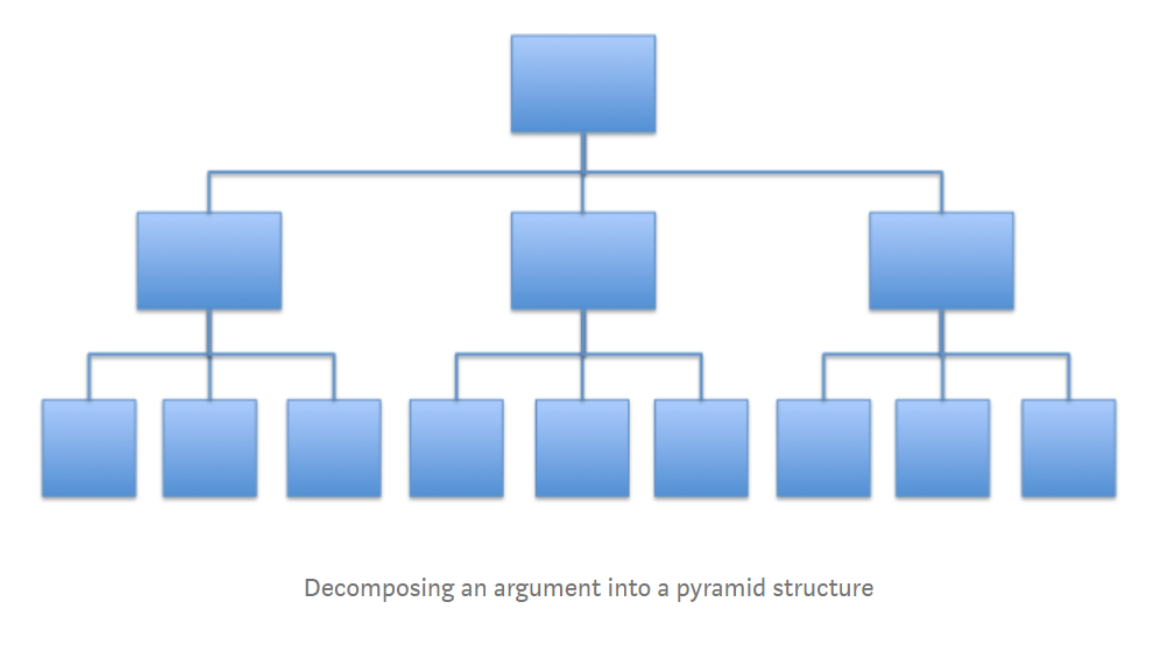
Once you give your answer, the next step is to give supporting arguments by grouping them in a pyramid-like structure. The answer is the apex of the pyramid. Underneath the answer, you are supposed to group and summarize the next level of supporting arguments. The key is that ideas at any level of the pyramid are summaries of the ideas grouped below them.
Ameet Ranadive, from ‘The Pyramid Principle’, accessed 18 June 2020.
3. Logically order your supporting ideas.
Then, the supporting arguments should be logically ordered. This can be in terms of time, structure, or degrees. A structural order is often very useful to help understand a model. Models can be broken down into:
- Assumptions
- Model components / Visualizations
- Results
Assumptions
When I say assumptions, I mean business assumptions you used to build your model. Hint: it is not “Variable X follows a normal distribution”. Assumptions sound more like: “We have assumed costs are likely to go up by 5% for the next year.” Your assumptions could also include the fact that you filtered out some input data to reflect the future in a better manner. In this case you might say, “We used x, y, z metrics from historical data (Year 2000-2019) to train the model.”
Model Components / Visualizations
Eric Weber, a data scientist, once said that data people need to think like product marketers. The model you built is the product and you need to explain to corporate leadership (your customers) how it will make their life better. Model components should be summarized or represented visually in a flow chart for ease of understanding. For example, this is a flowchart I made for a pricing model that I built:

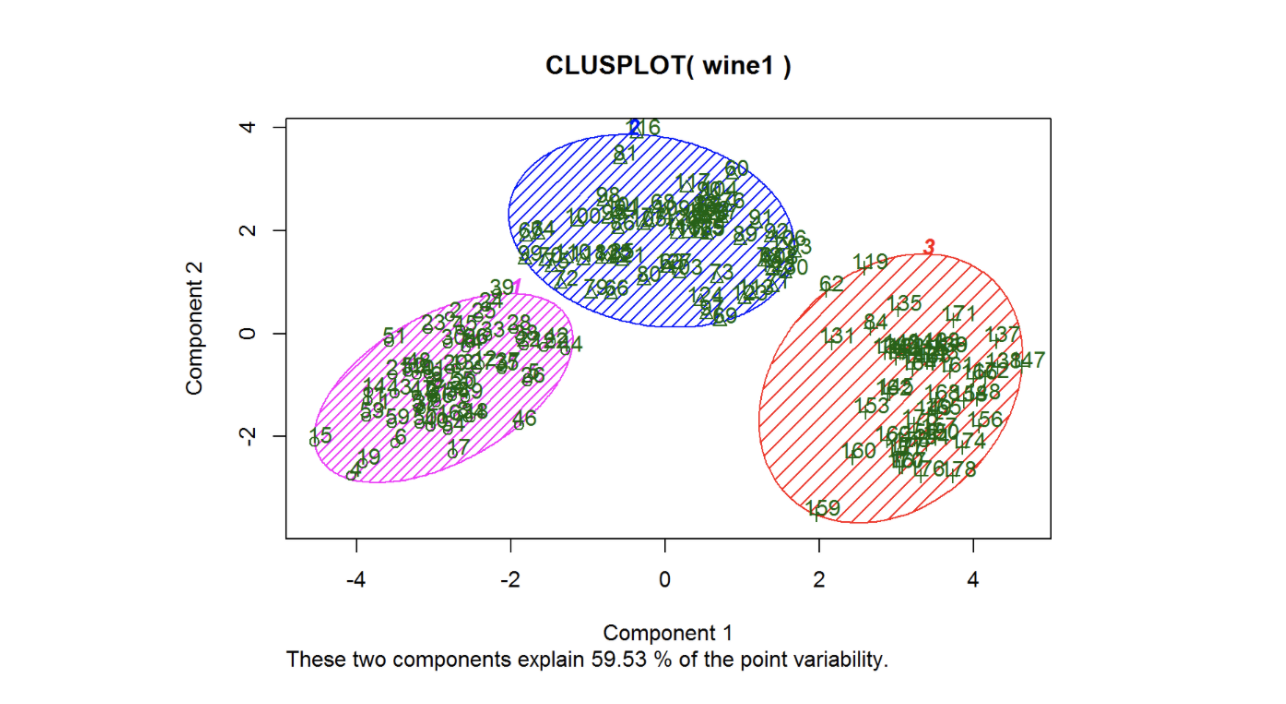
The value of a model doesn’t have to only be represented via a flowchart. For instance, a K-means clustering graph like the one below helps leadership clearly see the distinct product groups for the Wine dataset. This graph immediately illustrates what the clusters are as opposed to showing a bunch of statistics about the clusters.
Results
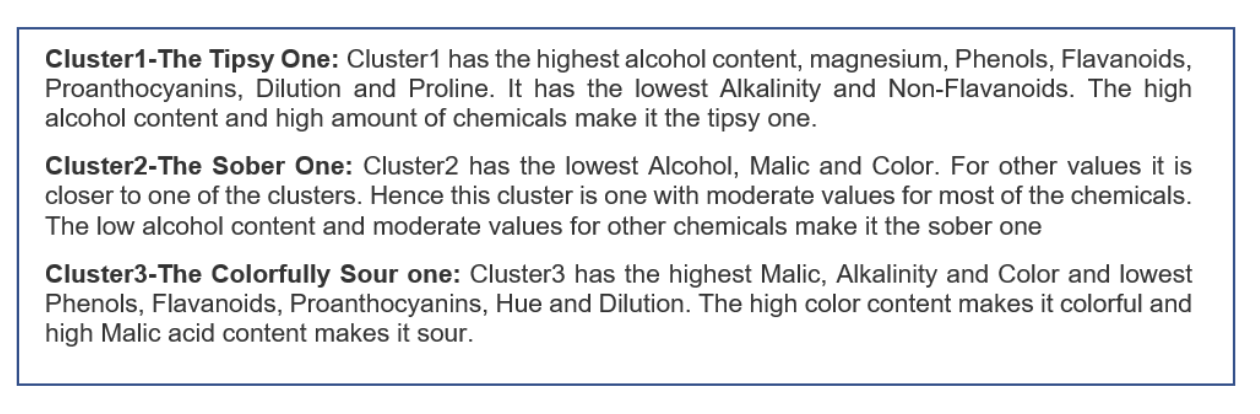
Results are the last component of the three-pronged structure. It is important to compare your model to a baseline to show how your model is better than the existing scenario. For unsupervised techniques such as clustering, you must interpret the clusters in a way that your audience will understand.
For example, we can interpret the clusters for the Wine dataset as below.
Consider presenting measures of your model’s effectiveness using metrics such as accuracy, precision, recall, F score, and Mean Absolute Error. Ensure that you provide a simple explanation of what each metric means and why you chose that metric to rate your model.
But perhaps the most important thing is to tie the model result to a KPI that the business is really interested in. For example, “clustering customers will help target customers more effectively in the next marketing campaign, resulting in a x% increase in click through rates/open rates.” If it is difficult to estimate an exact number or percentage, give a confidence interval. This helps everyone understand the business value of the model.
Conclusion
There are three main parts to a model presentation: a punchline to show the model’s business value; business assumptions and thoughtful visualizations; and a simple explanation of model effectiveness in addition to tying it to a business KPI.
Conducting a presentation in this manner ensures that the business and data team are on the same page. When leaders can clearly see business value, they are more likely to become champions of data-driven decision making.
About the author:
Indhujha Natarajan is an Analytics Manager at Sears Holdings (Transform Co) where she works on Financial Analytics and Strategy. She has an MBA from Purdue University and a Masters in Analytics from Harrisburg University. See Indhujha’s work on her Github or follow her on LinkedIn.